The goal of a fusion reactor is to provide sustainable energy, therefore it needs to generate more energy than it consumes during startup and operation.
This threshold is given by the Lawson criterion, the triple product of the density, confinement time, and plasma temperature should be larger than some critical constant. Provided that there is an optimal plasma temperature for fusion and a maximum density (Greenwald limit), one of the most important free parameters to improve the efficiency is the confinement time. The confinement time is governed by the physical dimensions of the reactor and the rate at which heat and particles are transported through the plasma and lost to the wall. The reactor dimensions are fixed during design and construction, therefore it is important to study heat transport as a way to control and optimize the energy confinement time.
The heat transport is governed by physical processes such as diffusion and convection that occur mostly due to plasma turbulence. However, these processes cannot be measured directly in the plasma, but can only be estimated from other measurements. Therefore, our group develops new methodologies to determine the transport parameters from, e.g., temperature measurements. The complexity of transport problems is that the temperature is a function of time and space, hence, we are dealing with a distributed parameter system (also called an infinite dimensional system). To estimate these parameters as function of space, our group performs perturbative experiments and measures the evolution of the temperature over time on different spatial positions. As experiments are often very short and noisy, we use advanced frequency domain techniques to filter the data and develop our estimators. With our newly developed estimation techniques such as the three point method, we provide estimates of these physical properties (diffusion, convection and power deposition profile) including their confidence.
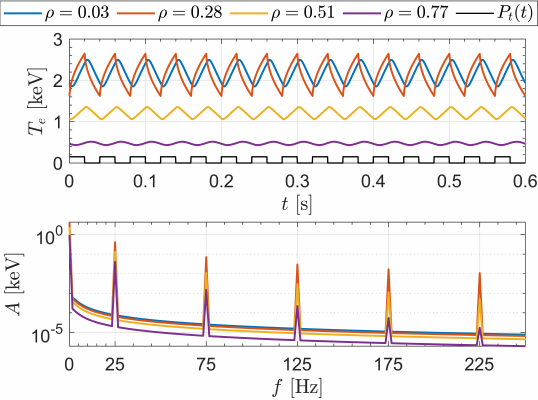
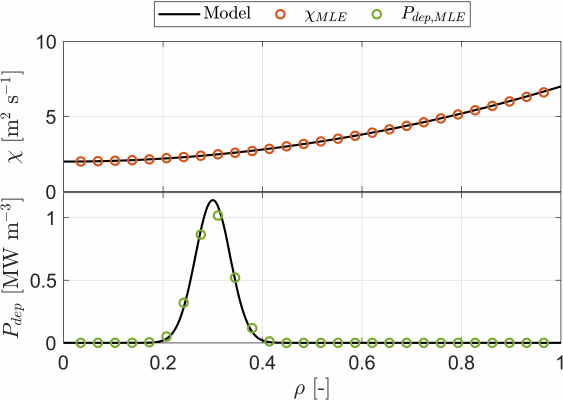
Figure: (Left) The temperature fluctuations at different spatial locations (color) caused by a perturbation of the heat source (black). The top shows the temperature as a function of time, while the bottoms shows the frequency content of the signal. (Right) Estimates of the diffusion and power deposition profile using the our novel 3-point Maximum Likelihood Estimator on the frequency content of the temperature.
Back to Research.